
A Goldilocks-like environment for growth assets is provided by key economic variables that are neither too hot nor too cold. The bull market in equities continues, but it is maturing. Corporate earnings are likely to take over from monetary stimulus as the main share price driver.
However, the chance of a meaningful pullback in share prices has grown in recent months and this would provide opportunities for patient investors to buy high quality assets more cheaply. Equity returns should still be positive in the next few years, but are unlikely to match gains typical of the past.
Risks are elevated and include the potential for credit-related issues dragging China growth, adverse European geopolitical shifts and policy error as central banks reduce extraordinary monetary stimulus. High expectations in share prices means disappointments will be dealt with by the market more brutally.
Meanwhile, economic expansion is gaining momentum. Global GDP is likely to grow by over 3 per cent in 2017 and pick up further in 2018. All the world’s 20 largest economies are now improving, so there is a broadening of growth that hasn’t been seen for some years. Supporting factors are lower energy costs, increased consumer and business confidence, the promise of greater fiscal support and a weaker US dollar assisting global trade.
Inflation is increasing, but only modestly. Interest rates are likely to rise further, but not dramatically so in the next year, allowing economies to continue to improve. Relatively benign conditions should allow emerging markets to outpace developed economy growth.
Commodities are unlikely to rise sharply from current levels. A meaningful fall in oil prices which would again pressure energy producers and banks is a risk but not the most likely scenario.
Key potential political impediments to global expansion have not materialised. Changes to US trade policy will need to be watched closely. North American Free Trade Agreement (NAFTA) negotiations are commencing soon and the US is exploring options on steel and other specific trading arrangements.
There is still reasonable chance that fiscal policy will boost US earnings in 2018. Despite the healthcare fiasco and lack of progress on infrastructure, there has been some relief for businesses via reduced regulation within financial services and energy. Bipartisan support for tax cuts is reasonably likely though their degree will be moderated by the Republican will to prevent further extension of government debt.
Robust but subdued expansion continues in the US. Economic growth is likely to be above 2.2 over the next year. Inflation has been soft but should rise modestly as the labour market tightens. Consumption growth is assisted by continued job gains and expectations of personal income tax cuts in 2018. Business activity is helped by margin gains through cost containment and a recovery in capital expenditure especially in the energy sector.
The US leading indicator index implies continuing growth with little evidence of imminent recession.
CHART 1: US LEADING INDEX
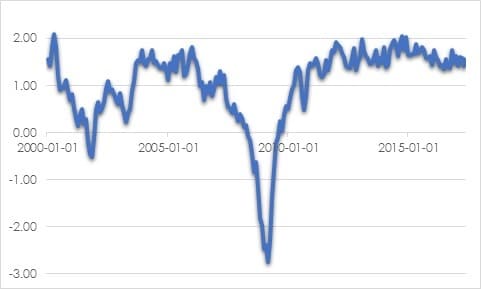
Source: St Louis Fed
In Europe improving conditions are becoming more entrenched, seen through growth in bank lending, construction activity and employment. European GDP growth is likely to exceed 2 per cent over the next year. Unemployment is likely to fall to 9% by the end of the year and below that in 2018. There is substantial room for consumption to expand and for businesses to add to capacity. Increased industrial, services and consumer confidence points to increasing spending and investment.
CHART 2: EUROPEAN CONFIDENCE

Source: European Commission
Unwinding extraordinary stimulus could disrupt markets
In the aftermath of the global financial crisis, central banks cut interest rates to zero or below and purchased assets to suppress interest rates and lift confidence in the financial system. The improvement in global economic growth and rise in inflation provides the impetus to start unwinding these emergency policy settings.
The US Federal Reserve is the first central bank to reduce monetary accommodation. The official cash rate has been lifted by four 25 basis point moves since December 2015. It is likely to be raised again in December this year and by two or three more times in 2018. This pace is faster than the market expects and may prompt some asset price volatility. With the hope of building a buffer ahead of the next downturn, it is unlikely to be delayed if inflation remains somewhat below target levels.
The US Federal Reserve is also about to start reducing the size of its balance sheet from around USD 4.5 trillion. This will be done by capping the quantity of government and mortgage-backed securities that will be reinvested upon maturity.
CHART 3: US FED BALANCE SHEET (USD TR)
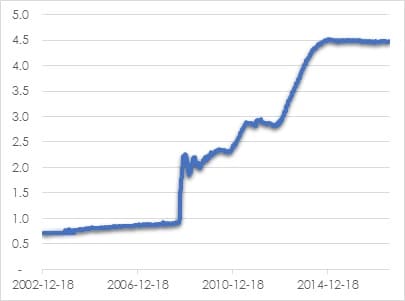
Source: St Louis Fed
As economies improve elsewhere, other central banks are readying for less expansionary monetary settings. Europe appears next in the queue, particularly given improving economic momentum with inflation closing in on the 2 per cent target level. The first tightening steps are likely in 2018. As a proportion of GDP, European and Japanese central bank asset purchases have been even greater than those in the US.
The chance of misstep is high given the experimental nature and scale of the programs being unwound. Market concerns over the potential for policy error are likely to cause asset price volatility over the next year or so.
The US Federal Reserve raising interest rates at the same time as reducing the size of its balance sheet raises the risk of putting the brakes on the US economy too quickly. There is some risk that European Central Bank could taper bond purchases in tandem. Mismanaged, the fall in bond demand could prompt a more rapid rise in bond yields.
However, just as central bank asset purchases to some degree have weighed on bond yields and allowed asset prices to inflate, unwinding will at least partially have the reverse effect.
Evidencing the challenges, US household net worth as a percent of disposable income is the highest since our data starts in 1952. Imbalances derive from modest income levels and ultra-low borrowing rates that have pushed up asset prices. Previous peaks were in 2000 before the tech wreck and 2007 before the global financial crisis.
CHART 4: HOUSEHOLD NET WORTH % DISPOSABLE INCOME
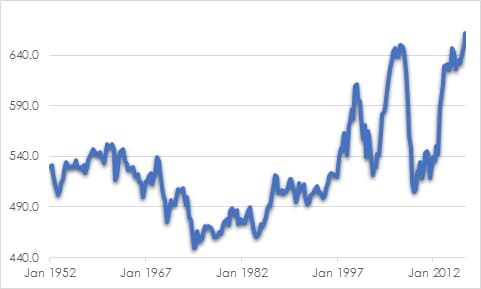
Source: St Louis Fed
Andrew Doherty, director, AssureInvest


