The growth outlook for shares
While the uptick in the global economy in the past few months has supported growth assets, SMSF practitioners still need to watch valuations.
The most synchronised pick-up in global activity for some time provides a supportive backdrop for growth assets. High levels of remaining capacity and still modest interest rates are helping to elongate this recovery period.
Confidence has improved since February 2016, coupled with the sharp rebound in commodity prices which has spurred industrial activity. Political risks are dissipating in Europe following elections in France and Holland that grant less power to populist parties than might have been the case. Emerging markets growth is picking up, helped by the likelihood of only gradual US rate hikes and progress on structural reform in several countries.
The US continues to expand through a strengthening consumer, further housing gains and renewed corporate impetus to invest. While there is high uncertainty over the detail, some form of fiscal expansion through tax reform and infrastructure investment is likely to contribute to growth in 2018.
It is unlikely that the new administration will be able to boost longer term GDP growth dramatically but the global economic recovery is not reliant on what it is able to enact in any case.
Share prices are full but not excessive. Earnings need to expand to justify current equity valuations and we expect this to be the case particularly through improving economies and higher commodity prices. The current US quarterly earnings season should be the strongest for some time. Factset estimates a 9 per cent annual rate of earnings growth which would be the fastest growth since 2011.
Softness in global equity markets during April was an unsurprising hiatus in an ongoing bull market. The Trump administration’s legislative agenda and geopolitical issues partially weighed on share prices. Sharper downturns should be expected as this cycle matures.
Monetary policy remains accommodative
The US Federal Reserve has commenced an upward interest rate path but monetary policy is still supportive of economic conditions. Rates will be constrained to only a gradual upward path by the mildness of economic growth and high indebtedness of corporates and government which exaggerates the impact of higher rates on investment and spending decisions.
Rates are accommodative until real rates (that is, after inflation) turn positive. With core PCE inflation now 1.8 per cent, the real Fed funds rate is around -1 per cent. Two or possibly three further rate hikes are likely this year. A more neutral Fed funds rate will not be reached until at least March next year.
The US Federal Reserve is yet to decide how it will go about reducing the size of its balance sheet. It is likely to move very slowly to avoid financial market disruption of the type experienced in the ‘taper tantrum’ of 2013 when reductions to asset purchases were first flagged. The likely initial move is to reduce the value being reinvested once bonds mature from early next year.
In Europe, underlying inflation has modestly lifted, but at 0.9 per cent remains below the European Central Bank (ECB) target of 2 per cent. Highly expansionary monetary policy will persist for some time yet. In Japan, monetary stimulus including asset purchases will continue to target low lending rates while reducing the funding costs of fiscal measures.
Key drivers of growth are in the slow lane
No matter the extent of the short-term bump from fiscal action, subdued longer term US economic growth appears to be predetermined. We expect 2.1 per cent per annum growth over the next five years, which despite being above most western world economies is modest by historic standards.
There are two key drivers of real GDP growth – labour force expansion and productivity gains. In the last 30 years, the average annual growth rate in the US labour force over each five-year period declined to around 0.7 per cent per annum from 1.8 per cent. The current economic expansion has allowed some recovery. The US Bureau of Labor Statistics projects just 0.5 per cent per annum growth in the US labour force to 2024 to 163.8 million people.
CHART 1: US LABOUR FORCE GROWTH
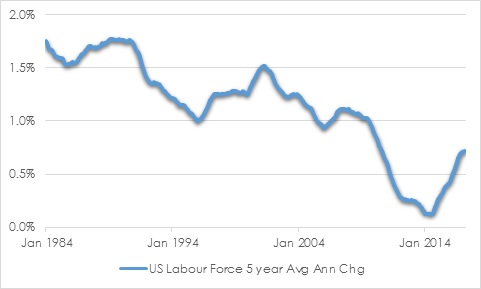
Source: St Louis Fed
The two main factors weighing on labour force growth are declining workforce participation and the aging population. Workforce participation has declined to 63 per cent from 67 per cent in year 2000. Female participation has been modestly declining since 2000 after boosting labour market growth through the 1970s and 1980s. Male workforce participation has been in steady decline since 1960.
CHART 2: US GENDER PARTICIPATION
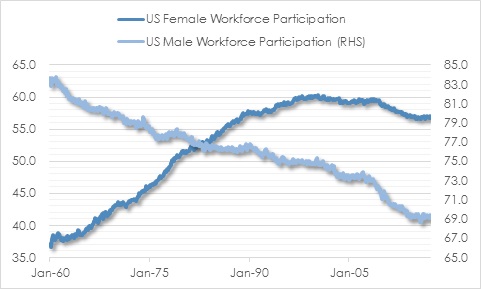
Source: St Louis Fed
Baby Boomers are now beginning to exit the workforce. The World Bank expects the proportion of the US population that is 60 years or older to rise to 26.1 per cent in 2030 from 20.7 per cent in 2015. As the population ages, more people drop out of the workforce. Healthcare and social assistance sectors should contribute the most to job growth, offset by declines in manufacture, federal government and agriculture.
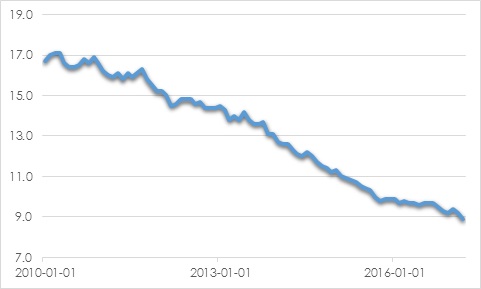
US unemployment is now at a historically low 4.5 per cent. While the labour market is getting tighter, there are factors allowing an extended period of employment growth while fuelling only mild wages inflation. Participation among the working age population (25-54 years) has increased since mid-2015 and there is scope for this to continue. Underemployment should also continue to fall as new full-time positions become available. Underemployed people have work but not as much as they would like.
CHART 3: US WORKING AGE PARTICIPATION
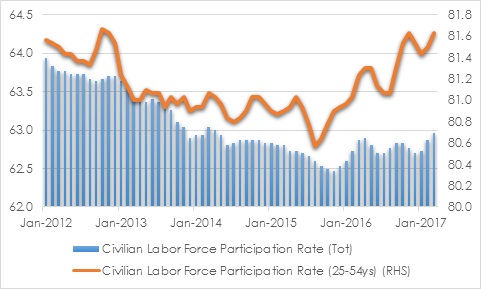
Source: St Louis Fed
CHART 4: US UNDEREMPLOYMENT RATE
US policy changes including tighter immigration restrictions could further weigh on labour force growth, reducing the administration’s ability to achieve its economic growth goals.
The other key component of GDP growth, productivity, has also declined. Productivity growth has averaged 1.5 per cent per annum since 1947 but has reduced to just 0.4 per cent on average over the past five years.
CHART 5: US PRODUCTIVITY GROWTH
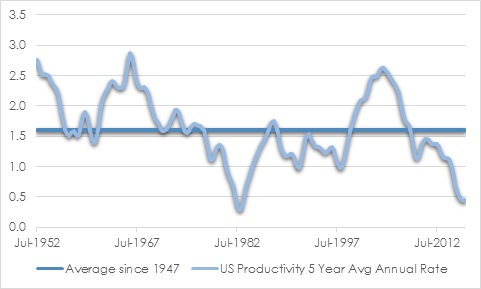
Source: St Louis Fed
Why productivity is so low is hard to pinpoint? It is reasonable to expect some improvement as capital expenditures rise with improved business confidence. US private investment as a percentage of GDP is below the long-term average and this is restricting potential productivity improvements.
CHART 6: US INVESTMENT PERCENTAGE OF GDP
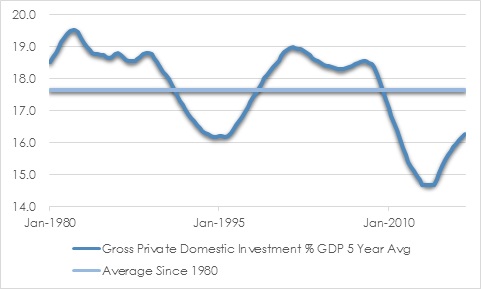
Source: St Louis Fed
Ultra-low interest rates in recent years have encouraged companies to buy back stock instead of investing. This trend could reverse as rates drift higher over the next few years. Investments in productive infrastructure could also help lift productivity. A cut to tax rates would help boost activity in the first year but is unlikely to help much beyond that.
In any case, several more structural factors are likely to constrain productivity levels below the long-term historical growth rate. Innovations in recent years have been less transformative than the electrification, automobile and wireless communications breakthroughs in the 20th century. Recent developments such as smartphones, the so-called sharing economy and various medical advances are yet to be fully monetised. Aging demographics also reduces potential consumption except for various healthcare and financial services.
Andrew Doherty, director, AssureInvest