Where to turn in a yield-starved world? By Russel Chesler, director – investments, VanEck

Promoted by VanEck.
We live in a new world.
Before the GFC, Australian investors could invest in term deposits or government bonds and receive a stable, risk-free income that they could rely on to support them in retirement. But as interest rates have dropped over the last decade, a new era has begun in which the outlook points to low rates for longer.
Last year, the world reached a peak of more than $17 trillion of debt with below-zero yields1. Meanwhile, Denmark and Switzerland made the record books for having the world record in negative interest rates at -0.75 per cent2. Sweden and the Eurozone currently both have 0 per cent interest rates3.
Investors are seeking alternatives to traditional income assets to both diversify and expand income sources.
The ‘new world’ of emerging markets bonds
Emerging markets bonds are, as the name suggests, bonds issued by governments and companies in emerging markets. Despite emerging markets representing over 50 per cent of global GDP, the level of EM bond issuance and investment is nowhere near what would be implied by their contribution to global growth.
Many emerging markets boast strong economic performance based on good economic policy decision-making in the last 15 years, which has made them stronger than many of their developed market counterparts. For example, because they had worked hard to improve their reserves and their balance of payments, many EM countries came through the GFC in better shape than their developed market counterparts.
There is a new world order and emerging markets bonds are at the forefront of this change.
The past 15 years have demonstrated that EM bonds can reward investors without extreme risks previously associated with emerging market debt. Emerging markets data has become increasingly transparent and reliable and they built up their reserves.
EM bonds have produced positive returns in 14 of the last 15 years.
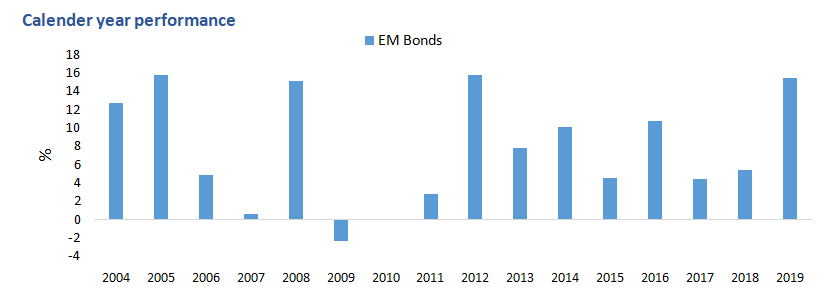
Source: Morningstar Direct. Data as at 31 December 2019. Data is in Australian dollars. EM bond is 50% JPM EMBI Global Diversified and 50% JPM GBI-EM Global Diversified. This index is used to illustrate historical performance of the EM bond market only. It is not the benchmark for EBND. You cannot invest in an index. Past performance of the market is not a reliable indicator of future performance of the fund.
And EM bonds have been offering attractive yields relative to developed market bonds.
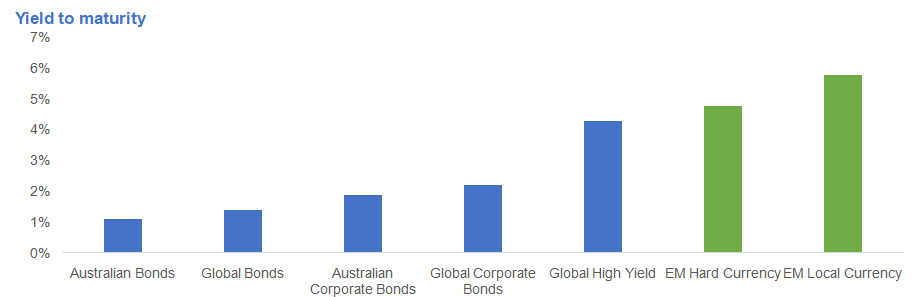
Source: Bloomberg. Data as at 31 December 2019. Data is in Australian dollars. You cannot invest in an index. Past performance is not a reliable indicator of future performance. Indices used: Australian Bonds - Bloomberg AusBond Composite 0+ Yr Index; Global Bonds - Bloomberg Barclays Global-Aggregate Total Return Index Hedged AUD; Australian Corporate Bonds - Bloomberg AusBond Credit 0+ Yr Index; Global Corporate Bonds - Bloomberg Barclays Global Aggregate Corporate Bond Index (AUD Hedged); Global High Yield - Markit iBoxx Global Developed Markets Liquid High Yield Capped Index (AUD Hedged); EM Hard Currency - J.P Morgan Emerging Markets Bond Index Global Diversified (EMBIGD) – EMBIGD is unhedged, EBND will hedge its hard currency; EM Local Currency - J.P. Morgan Government Bond Index-Emerging Markets Global Diversified (GBI-EM).
Looking ahead in the new world
Many EM economies are as structurally sound and well managed as developed market economies, and in many cases better. Current accounts and government budgets are largely in check. Policymakers, appealing to ever-growing and better-educated middle classes, are encouraging savings and pension reforms which is driving capital investment. Today, the new world of EM debt is characterised by higher foreign exchange reserves and lower spreads on bonds (relative to US treasuries), as the chart below shows.
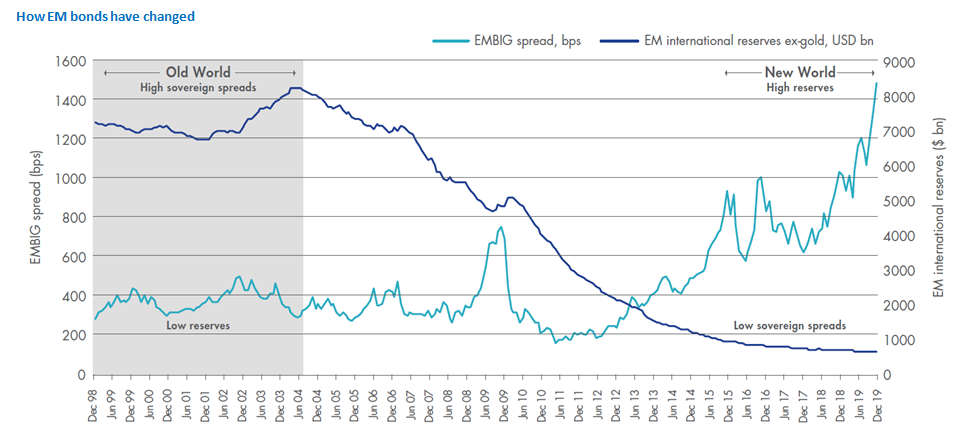
Source: Bloomberg, VanEck Data to 31 December 2019. EMBIG spread is the difference between EM hard currency sovereign bonds and US treasuries, and is captured by the JP Emerging Bond Index Global Sovereign Spread.
This contrasts with the “old world”, where two decades ago EM bonds were risky and volatile due to low reserves and the inability to absorb losses, coupled with a lack of transparency of financial information. This was typified by the 1997 Asian financial crisis and the 1998 Russian financial crisis, then Argentina’s much-publicised default in 2001. These crises set the scene for significant economic reforms through the early part of the new millennium. Many emerging markets were forced to be fully transparent with their data to garner support from foreign investors and global monetary funds, often for the first time. As a result, many came out of the GFC structurally stronger than their developed market counterparts.
Drawdown
No investor wants to lose money and investors spooked by events over 20 years ago can look at a measure called “drawdown” to determine how emerging markets bonds have improved. Drawdown demonstrates both the depth of a fall from a historical peak and the pace of the recovery to a new peak.
The chart below shows the drawdown of EM bonds versus other asset classes over the past 15 years, capturing the GFC. You can see that falls by EM bonds were closer to developed markets bonds than equities during the GFC and the debt crises of ’09 and ’11.
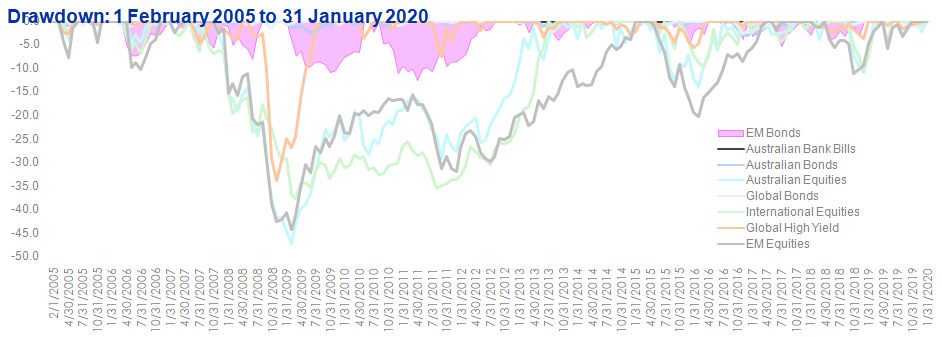
Source: Morningstar Direct. Results are calculated monthly and assume immediate reinvestment of all dividends. You cannot invest in an index. Past performance is not a reliable indicator of future performance. Indices used: Australian Bank Bills – Bloomberg Australian Bank Bill 0+ Yr Index; Global Bonds – Barclays Global Aggregate Bond Index A$ Hedged; Australian Bonds – Bloomberg AusBond Composite 0+ Yr Index; Australian equities – S&P/ASX 200; Global equities – MSCI World ex Australia Index; EM equities – MSCI Emerging Markets Index; Global High Yield – Bloomberg Barclay Global High Yield Index A$ Hedged; EM Bonds – 50% JPM EMBI Global Diversified and 50% JPM GBI-EM Global Diversified. This index is used to illustrate historical performance of the EM bond market only. It is not the benchmark for EBND aims to outperform.
The income opportunity
Many of the biggest investors around the world are increasing their allocation to emerging market bonds; CalPers, Sweden’s AP2 and Australia’s own Future Fund have increased their exposure to emerging markets bonds. But most Australian investors have been missing the opportunities presented by emerging markets bonds simply due to lack of access and understanding of where it fits in a portfolio. Until now it has been almost impossible for most investors to invest in bonds from emerging markets and equally challenging to take an informed view as to which bonds present the best opportunity.
However, the VanEck Emerging Income Opportunities Active ETF (Managed Fund) (ASX: EBND) offers a fully transparent, actively managed fund of emerging markets bonds and currencies that can be bought and sold on the ASX.
EBND has a targeted yield of 5 per cent p.a.* and enables investors to access a globally diversified portfolio of emerging markets bonds via a single trade on the ASX.
Source: Bloomberg, Bloomberg Barclays Global Aggregate Negative Yielding Debt Index - 12 Feb 2020.
Bloomberg.com 10 Feb “The World’s Lowest Interest Rate…” – N. Rigilllo
Source: Trading Economics
*Each month the Responsible Entity of the Fund (“the RE”) will determine the cash amount of the dividend to be paid in the best interests of investors, taking into account all relevant factors including the Fund’s investment objective and its economic performance. In determining each month’s dividend, the RE will target an annual dividend yield of 5 per cent p.a. of the capital invested at the beginning of the period.
From time to time, the RE may amend this target in the best interests of investors.
Disclaimer: This information is issued by VanEck Investments Limited ABN 22 146 596 116 AFSL 416755 as the responsible entity of the VanEck Emerging Income Opportunities Active ETF (Managed Fund) (“EBND”). This is general information only about a financial product and not personal financial advice. It does not take into account any person’s individual objectives, financial situation or needs. Before making an investment decision, you should read the PDS and with the assistance of a financial adviser consider if it is appropriate for your circumstances. The PDS is available at www.vaneck.com.au or by calling 1300 68 38 37.
EBND invests in emerging markets. An investment in EBND has specific and heightened risks that are in addition to the typical risks associated with investing in the Australian bond market. See the PDS for more details of the key risks.
No member of the VanEck group guarantees the repayment of capital, the payment of income, performance, or any particular rate of return from EBND.